


INVESTIGATION OF DYSPHAGIA LIMIT OUTCOMES IN HEALTHY YOUNG ADULTS: AN OBSERVATIONAL-DESCRIPTIVE STUDY
2Lokman Hekim Üniversitesi, Dil ve Konuşma Terapisi, Ankara, Türkiye
3Yüksek İhtisas Üniversitesi, Dil ve Konuşma Terapisi, Ankara, Türkiye
Summary
Objective: Dysphagia Limit (DL) is an electrophysiological assessment tool used in swallowing evaluations. The main objective of this study was to examine DL findings in healthy young adults aged 18-25 years.Material and Methods: A total of 100 individuals (50 males and 50 females) were included in the study. During DL measurements, each participant underwent swallowing trials using thin liquid in 5 mL increments (5, 10, 15, 20, 25, 30 mL, etc.), while submental surface electromyography (sEMG) recordings were simultaneously recorded. When a secondary swallow and/or aspiration sign was observed in the sEMG trace, the trial was terminated and the corresponding volume was recorded as the DL.
Results: No statistically significant difference was observed between the ages of male and female participants (z = -0.428, p = 0.668). The median (min-max) DL was 30 (20-55) mL in all participants, 37.5 (20-55) mL in males, and 30 (20-50) mL in females. A significantly higher DL finding was detected in males compared to females (z = -3.719, p < 0.001). A weak but statistically significant positive correlation was found between body mass index (BMI) and DL in all individuals (r = 0.212, p = 0.046).
Conclusion: DL reference values were established for the first time in a healthy young adult population, and it was demonstrated that DL may be influenced by variables such as gender and BMI. The current findings were considered to be important for both clinical evaluation processes and future research.
Introduction
Dysphagia is a clinical symptom characterized by swallowing difficulties resulting from disorders affecting anatomical regions from the oral cavity to the stomach.[1] Swallowing is a complex activity involving at least 20 muscles and several cranial nerves.[2,3] Neurological diseases, head and neck cancers, traumatic brain injuries, systemic diseases, gastroesophageal reflux, and esophageal motility disorders are among the major etiologies leading to dysphagia.[4] Owing to its associated morbidity and mortality, accurate diagnosis and treatment of dysphagia are crucial for patient health. Comprehensive evaluation plays a key role in determining an appropriate treatment plan, as incomplete or inappropriate assessment may result in dehydration, malnutrition, respiratory infections, or even death.[5] Additionally, dysphagia significantly reduces quality of life, affecting social and psychological well-being and often leading to social isolation and anxiety.[6]Fiberoptic Endoscopic Evaluation of Swallowing (FEES) and Modified Barium Swallow Study (MBSS) are internationally accepted and commonly used gold standard methods in swallowing assessment.[7] However, both methods have inherent limitations. MBSS involves radiation exposure, cannot detect neuromuscular abnormalities of the laryngeal or pharyngeal regions, and is costly and time-consuming. FEES requires complex equipment, may cause discomfort, cannot assess the oral phase, and is also time-consuming and expensive.[8] These limitations have encouraged researchers and clinicians to explore reliable, non-invasive, cost-effective, and easily applicable clinical tools for swallowing assessment.
Surface electromyography (sEMG) has long been used in the evaluation of swallowing disorders.[9-12] One of the most widely studied electrophysiological tools, developed by Ertekin et al.[13] is the Dysphagia Limit (DL) which is defined as the smallest bolus volume that cannot be swallowed in a single attempt and requires two or more swallows to complete. Previous studies have demonstrated that the DL method is a reliable screening tool for identifying swallowing disorders across various patient groups.[14-17] In one study (20 men and 10 women, mean age = 43.0 ± 17.6), Ertekin et al.[13] reported that healthy individuals could swallow boluses up to 20 mL in a single attempt, establishing 20 mL as the DL threshold. Another study conducted by Ertekin et al.[18] included a total of 252 participants, consisting of 75 healthy individuals and 177 patients diagnosed with neurogenic dysphagia, to evaluate DL findings. The healthy participants were examined in three distinct age categories (17-39, 40-59, and 60-81 years), and DL findings greater than 20 mL were observed in all groups. However, the aforementioned studies did not provide clear data regarding the mean or median values of DL findings within these age groups. Furthermore, a review of the literature revealed no studies that accurately reflected DL findings specifically in the young adult population (18-25 years).
Due to the alterations in the neurophysiology of swallowing associated with aging, swallowing kinematics also differ across age groups.[19,20] Although dysphagia is known to increase with advancing age, it should be noted that this symptom may occur in all age groups as a result of various pathological conditions.[4,21,22] In the young adult population, numerous mechanical or obstructive clinical conditions, primarily caused by immunological or gastroesophageal factors, may lead to swallowing disorders.[4,23] Therefore, the age factor should always be taken into account when determining normative values specific to swallowing assessment methods[24]. Furthermore, establishing age-specific normative data for swallowing disorders, objectively evaluating swallowing function at an early stage, and using sensitive measurements to detect dysphagia risk are all crucial for both screening and early diagnosis.
In light of current knowledge, previous studies have generally reported DL findings only as values greater than 20 mL, without providing clear evidence regarding the mean or median DL values. Moreover, no study has been found investigating DL normative data across different age groups. Accordingly, the present study aims to investigate the DL method-an electrophysiological tool for swallowing assessment-in healthy young adults (18-25 years) and to provide reference values for the DL parameter within this population.
Methods
This observational-descriptive study was conducted in XXX. Ethical approval was obtained from the XXX Ethics Committee (approval code: 2025-848). All participants provided written informed consent prior to participation, and the study was carried out in accordance with the principles of the Declaration of Helsinki.
Participants
The study included 100 participants (50 males and 50 females) aged 18-25 years with no swallowing-related complaints and normal swallowing function. Height and weight were measured for all participants to calculate BMI. Exclusion criteria included a history of head and neck surgery (excluding septoplasty and rhinoplasty), cardiac disorders, active pacemaker or other electronic implants, epilepsy, systemic or endocrine disorders (i.e., diabetes mellitus, Sjögren's syndrome) causing xerostomia, and inability to comply with the study protocol.
Electrophysiological Assessment (Dysphagia Limit)
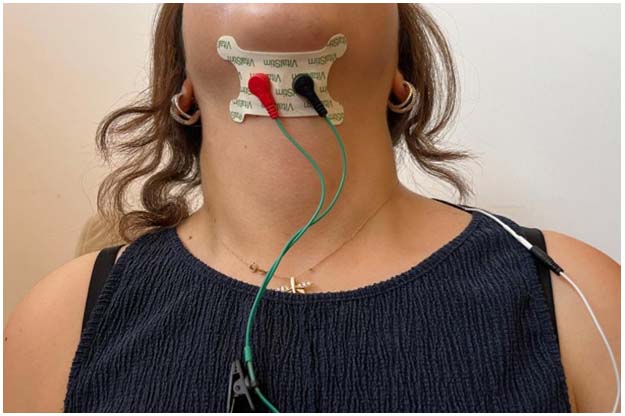
Electrophysiological recordings were obtained using the sEMG protocol of the VitalStim Plus (Chattanooga Group, Hixson, TN) system. A pair of surface electrodes (Chattanooga VitalStim Plus Electrodes) was placed horizontally and bilaterally on the submental region along the midline, with a reference electrode placed over the trapezius muscle (Figure 1). Before electrode placement, the submental region was shaved in male participants, and related skin areas were cleaned with 70% alcohol.
 Büyütmek İçin Tıklayın |
Figure 1: Electrode placements during DL measurements |
During the dysphagia limit measurements, each participant's head was positioned upright and comfortably while seated, and they were instructed to maintain this posture throughout the assessment. After completing the electrode placements, the sEMG signals were integrated into a personal computer and monitored simultaneously. After ensuring that all electrodes had good surface contact with the skin, it was confirmed that the basal submental sEMG activation signals observable on the integrated system interface were below 5 mV.[12,25] Subsequently, swallowing trials were initiated by selecting the Start tab in the window opened via the Open Display option. The relevant interface allowed the examiner to stop (Pause) or resume (Continue) the sEMG signal recording as needed. After the swallowing trials were completed, the recordings were saved to the interface database under the corresponding participant code using the Finish and Save options, respectively.
Swallowing trials began with the administration of 5 mL of thin liquid (distilled water at room temperature) to each participant and continued with gradual 5 mL increments (5, 10, 15, 20, 25, 30 mL, etc.). Participants were instructed to hold the bolus in their mouth and swallow it upon receiving the "swallow" command from the examiner. The sEMG signals for each swallowing trial were monitored for 8 seconds.
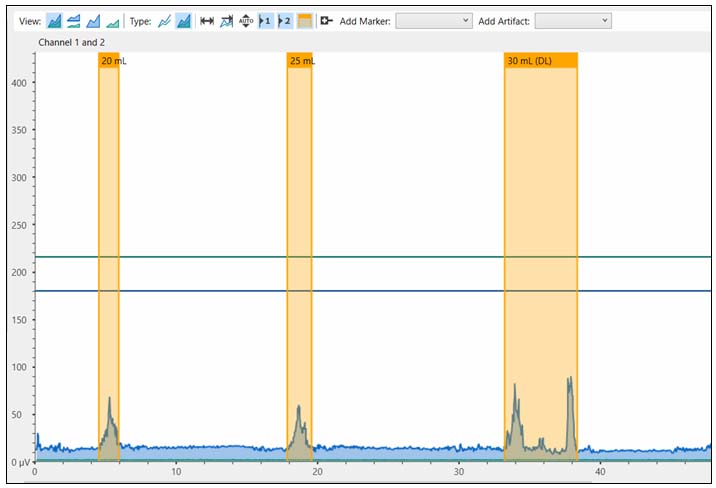
As shown in Figure 2, if any signs of secondary swallowing and/or aspiration symptoms were observed during the specified time period, the swallowing trials were terminated, and the corresponding volume was recorded as the DL value. Secondary swallows were considered as the distinct bursts of submental sEMG activity occurring within the 8-second observation window following the initial swallow. Aspiration-related symptoms were defined as coughing, throat clearing, or wet voice quality observed after swallowing. After each swallowing trial and the subsequent 8-second observation period, a minimum rest interval of 30 seconds was provided. The data were collected by four researchers who were undergraduate students in Speech and Language Therapy, under the supervision and guidance of two speech and language therapists with 10 years of experience in the field of swallowing disorders.The present DL procedure was implemented in accordance with the protocol described by Ertekin et al.[13]
 Büyütmek İçin Tıklayın |
Figure 2: sEMG signals of a participant whose DL volume was determined as 30 mL |
Statistical Analysis
Data analysis was conducted using the Statistical Package for the Social Sciences (SPSS, version 25.0, Chicago, IL). The normality of continuous variables was assessed using visual (histograms, Q-Q plots) and analytical methods (Kolmogorov-Smirnov and Shapiro-Wilk tests). Age, BMI, and DL were non-normally distributed and presented as median (min-max) values. Between-group comparisons were performed using the Mann-Whitney U test. Correlation between DL and BMI was examined using Spearman's correlation analysis. A p-value < 0.05 was considered statistically significant for the current study.
To support the adequacy of the sample size for secondary gender-based analyses, a post hoc power analysis based on the observed difference in DL values between males and females (Mann-Whitney U test, z = -3.719, p < 0.001; effect size r = 0.37) demonstrated that, with a two-tailed alpha level of 0.05, the inclusion of 100 participants (50 per group) provided a statistical power exceeding 0.95 (G*Power version 3.1.9.7).
Results
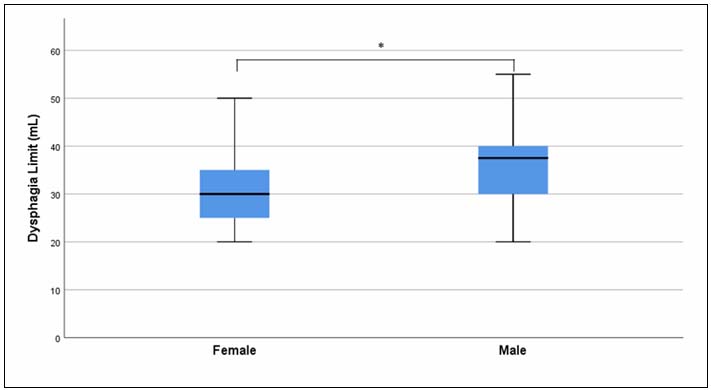
The median (min-max) age of all participants included in the study was 21 (18-24) years. The median (min-max) age for both male and female groups was also 21 (18-24) years, with no statistically significant difference observed between genders (z = -0.428, p = 0.668). The median (min-max) BMI value for all participants was 22.9 (15.2-38.6), while the median (min-max) BMI was 24.1 (18.9-38.6) in males and 20.4 (15.2-31.7) in females. The comparison by gender revealed that males had significantly higher BMI values than females (z = -4.345, p < 0.001).The median (min-max) DL finding for all participants was 30 (20-55) mL. When compared by gender, the median (min-max) DL value was 37.5 (20-55) mL in males and 30 (20-50) mL in females (Table 1). The comparison indicated that males had significantly higher DL values than females (z = -3.719, p < 0.001) (Figure 3).
)
Table 1: General characteristics and DL findings of participants
 Büyütmek İçin Tıklayın |
Figure 3: DL findings by gender |
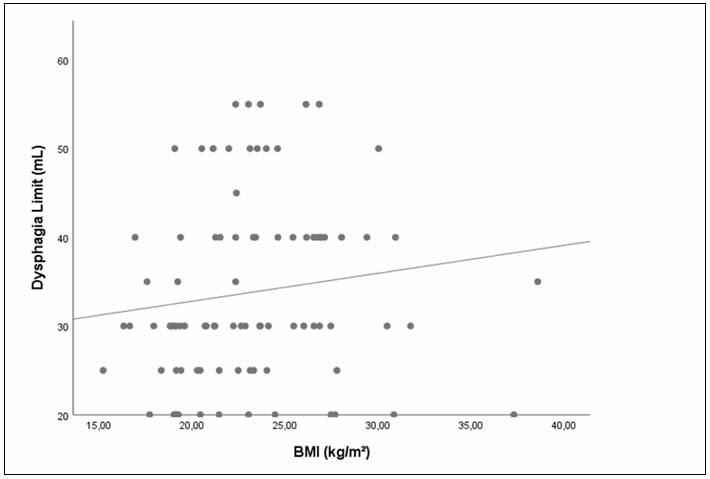
When examining the relationship between BMI and the DL parameter for all participants, a weak but statistically significant positive correlation was found between the two parameters (r = 0.212, p = 0.046) (Figure 4).
 Büyütmek İçin Tıklayın |
Figure 4: Relationship between DL and BMI parameters |
Discussion
In the present study, the median DL value for healthy individuals aged 18-25 years was found to be 30 mL (min-max = 20-55), and the DL values were statistically significantly higher in males compared to females. Additionally, a weak but statistically significant positive correlation was observed between participants" BMI and DL findings.A review of the literature revealed that studies investigating DL findings in healthy individuals without any swallowing disorder are limited. In this context, in a study conducted by Ertekin et al.,[13] DL findings of 30 healthy individuals (20 males and 10 females) aged between 20 and 71 years (mean ± SD = 43.0 ± 17.6) were reported to range between 25 and 40 mL. Similarly, in another study by Ertekin et al.,[18] DL findings were examined in a total of 252 participants, including 75 healthy individuals and 177 patients diagnosed with neurogenic dysphagia. The healthy participants were divided into three age groups: young (17-39 years, N = 38, mean age = 27.8 years), middle-aged (40-59 years, N = 17, mean age = 50.2 years), and elderly (60-81 years, N = 20, mean age = 69.2 years). In all age groups, the DL volume was reported to be above 20 mL. In a study conducted by Selçuk et al.,[26] the effect of thin liquid (water) at different temperatures on swallowing physiology was investigated using the DL method. Among 40 healthy participants (23 males and 17 females) with a mean ± SD age of 47.9 ± 15.6 years, DL values were found to be above 20 mL in all individuals, with an average DL of 30.5 ± 7.8 mL for water at room temperature. Consistent with previous findings, the present study also found that DL volumes were above 20 mL in all participants; however, the maximum DL volume reached up to 55 mL. The reason for the DL volume reaching up to the level of 55 mL might be that our study was conducted with a younger population compared to previous studies. It is known that with increasing age, coordination of the swallowing reflex, swallowing capacity, and the volume/thickness of swallowing muscles tend to decrease.[27,28] This could explain the higher DL volumes found in the young adult population examined in this study. Moreover, previous studies did not provide any mean or median DL values specific to a defined age group (18-25 years), making direct comparisons difficult. Additionally, technical differences exist between studies regarding the sEMG equipment used for DL measurement. Therefore, although this study provides specific normative DL values for young adults, the results should be interpreted with caution.
When DL findings were compared by gender, males showed significantly higher DL volumes (median = 37.5 mL) than females (median = 30 mL). This difference may be related to the larger oropharyngeal structures in males[29,30] and their greater suprahyoid muscle strength compared to females.[31,32] Supporting this, Colevas et al.[33] reported a statistically significant relationship between male gender and increased self-selected swallow volume. To the best of our knowledge, this study is the first to compare DL volumes by gender, suggesting that the influence of sex on swallowing volume should be considered in diagnostic evaluations.
A weak but statistically significant positive correlation was also found between BMI and DL values. Accordingly, as BMI increased, DL also showed a slight increase. Previous research has demonstrated a significant association between BMI and muscle mass, indicating that individuals with lower BMI are at higher risk of reduced muscle mass, while those with higher BMI have lower risk.[34-36] These findings suggest that an increase in overall muscle mass, including the submental muscle group, may lead to higher DL volumes. Therefore, the weak positive correlation between BMI and DL found in this study is consistent with the literature. Future studies using methods that directly assess isolated muscle mass rather than BMI could provide a more accurate understanding of the relationship between DL parameters and muscle mass.
Although the present study was designed to align methodologically with previous literature, several limitations should be noted. First, using measurement techniques that provide more specific information about body and submental muscle mass-rather than BMI-could enable a more accurate evaluation of the relationship between DL and muscle mass. Second, DL measurements in this study were obtained using the VitalStim Plus device's sEMG protocol. Although this device provides information on submental muscle activation and duration, the use of more specialized sEMG equipment may be beneficial to confirm the findings. Lastly, this study only reported DL findings for a young adult population. Given the scarcity of research presenting normative DL values across different age ranges and sexes, future studies investigating DL volumes in diverse age and gender groups would be highly valuable.
Conclusion
This study is the first to examine DL findings in healthy young adults and to present normative reference values for this population. The results revealed that DL volumes differ between genders and may vary in relation to individuals" BMI. Comparing the reference values obtained from young adults with data from individuals with swallowing disorders could provide valuable insights for both clinical swallowing assessments and future dysphagia research. Further studies with larger sample sizes are needed to generalize the present findings.Reference
1) Clavé P, Shaker R. Dysphagia: current reality and scope of the problem. Nature Reviews Gastroenterology & Hepatology. 2015;12(5):259-270. [ Özet ]
2) Dodds WJ. The physiology of swallowing. Dysphagia. 1989;3:171-178. [ Özet ]
3) Palmer JB. Electromyography of the muscles of oropharyngeal swallowing: basic concepts. Dysphagia. 1989;3:192-198. [ Özet ]
4) Roden DF, Altman KW. Causes of dysphagia among different age groups: a systematic review of the literature. Otolaryngologic Clinics of North America. 2013;46(6):965-987. [ Özet ]
5) Ekberg O, Hamdy S, Woisard V, Wuttge?Hannig A, Ortega P. Social and psychological burden of dysphagia: its impact on diagnosis and treatment. Dysphagia. 2002;17:139-146. [ Özet ]
6) Tibbling L, Gustafsson B. Dysphagia and its consequences in the elderly. Dysphagia. 1991;6:200-202. [ Özet ]
7) Langmore SE. Evaluation of oropharyngeal dysphagia: which diagnostic tool is superior? Current opinion in otolaryngology & head and neck surgery. 2003;11(6):485-489. [ Özet ]
8) Vaiman M, Eviatar E. Surface electromyography as a screening method for evaluation of dysphagia and odynophagia. Head & face medicine. 2009;5:1-11. [ Özet ]
9) Perlman AL. Electromyography and the study of oropharyngeal swallowing. Dysphagia. 1993;8:351-355. [ Özet ]
10) Vaiman M. Standardization of surface electromyography utilized to evaluate patients with dysphagia. Head & face medicine. 2007;3:1-7. [ Özet ]
11) Wang Y-C, Chou W, Lin B-S, Wang J-J, Lin B-S. The use of surface electromyography in dysphagia evaluation. Technology and Health Care. 2017;25(5):1025-1028. [ Özet ]
12) Gölaç H, Atalık G, Gülaçtı A, et al. Surface Electromyographic Activities of Submental and Infrahyoid Muscles: Comparisons Based on Residue, Penetration and Aspiration. Journal of Oral Rehabilitation. 2025; 52(5):616-623. [ Özet ]
13) Ertekin C, Aydoğdu I, Yüceyar N. Piecemeal deglutition and dysphagia limit in normal subjects and in patients with swallowing disorders. Journal of Neurology, Neurosurgery & Psychiatry. 1996;61(5):491-496. [ Özet ]
14) Schepers FV, van Hulst K, Spek B, Erasmus CE, van den Engel?Hoek L. Dysphagia limit in children with cerebral palsy aged 4 to 12 years. Developmental Medicine & Child Neurology. 2022;64(2):253-258. [ Özet ]
15) Belo LR, Gomes NAC, Coriolano MdGWdS, et al. The relationship between limit of dysphagia and average volume per swallow in patients with Parkinson?s disease. Dysphagia. 2014;29:419-424. [ Özet ]
16) Beckmann Y, Cakir A, Gürgör N, et al. Dysphagia limit in multiple sclerosis. Journal of the Neurological Sciences. 2015;357:e299.
17) Bautmans I, Demarteau J, Cruts B, Lemper J-C, Mets T. Dysphagia in elderly nursing home residents with severe cognitive impairment can be attenuated by cervical spine mobilization. Journal of Rehabilitation Medicine. 2008;40(9):755-760. [ Özet ]
18) Ertekin C, Aydogdu I, Yüceyar N, et al. Electrodiagnostic methods for neurogenic dysphagia. Electroencephalography and Clinical Neurophysiology/Electromyography and Motor Control. 1998;109(4):331-340. [ Özet ]
19) Walshe M. Swallowing and ageing. Speech, Language and Hearing. 2019;22(1):2-8.
20) Humbert IA, Fitzgerald ME, McLaren DG, et al. Neurophysiology of swallowing: effects of age and bolus type. NeuroImage. 2009;44(3):982-991. [ Özet ]
21) Cho SY, Choung RS, Saito YA, et al. Prevalence and risk factors for dysphagia: a USA community study. Neurogastroenterology & Motility. 2015;27(2):212-219. [ Özet ]
22) Leslie P, Smithard DG. Is dysphagia under diagnosed or is normal swallowing more variable than we think? Reported swallowing problems in people aged 18?65 years. Dysphagia. 2021;36(5):910-918. [ Özet ]
23) Basavaraju K, Wong T. Eosinophilic oesophagitis: a common cause of dysphagia in young adults? International journal of clinical practice. 2008;62(7):1096-1107. [ Özet ]
24) Garand KL, Grissett A, Corbett MM, et al. Quantifying pharyngeal residue across the adult life span: Normative values by age, gender, and swallow task. Journal of Speech, Language, and Hearing Research. 2023;66(3):820-831. [ Özet ]
25) O'kane L, Groher ME, Silva K, Osborn L. Normal muscular activity during swallowing as measured by surface electromyography. Annals of Otology, Rhinology & Laryngology. 2010;119(6):398-401. [ Özet ]
26) Selçuk B, Uysal H, Aydogdu I, Akyuz M, Ertekin C. Effect of temperature on electrophysiological parameters of swallowing. Journal of Rehabilitation Research & Development. 2007;44(3):373-380. [ Özet ]
27) Sporns PB, Muhle P, Hanning U, et al. Atrophy of swallowing muscles is associated with severity of dysphagia and age in patients with acute stroke. Journal of the American Medical Directors Association. 2017;18(7):635. e1-635. e7. [ Özet ]
28) Umay E, Akaltun MS, Uz C. Association between swallowing muscle mass and dysphagia in older adults: a case?control study. Journal of Oral Rehabilitation. 2023;50(6):429-439. [ Özet ]
29) Al-Bahrani ZM, Najm AA, Hadi FA. CBCT Analysis of Oropharynx Airway Volume. Journal of Craniofacial Surgery. 2023;34(8):e816-e818. [ Özet ]
30) Vadher V, Kumar CS, Khare V, Nande RS, Sharma S, Jain V. Assessment of relation of orofacial structures with pharynx among males and females: A lateral cephalometric study. Contemporary Clinical Dentistry. 2018;9(Suppl 2):S354-S357. [ 31) Curtis JA, Langenstein J, Troche MS, Laus J, Schneider SL. Open mouth-maximal isometric press: Development and norms for clinical swallowing evaluations and treatment. American journal of speech-language pathology. 2019;28(1):148-154. 32) Iida T, Tohara H, Wada S, Nakane A, Sanpei R, Ueda K. Aging decreases the strength of suprahyoid muscles involved in swallowing movements. The Tohoku journal of experimental medicine. 2013;231(3):223-228. [ Özet ]
33) Colevas SM, Stalter LN, Jones CA, McCulloch TM. The natural swallow: factors affecting subject choice of bolus volume and pharyngeal swallow parameters in a self-selected swallow. Dysphagia. 2022;37(5):1172-1182. [ Özet ]
34) Xie R-Z, Li X-S, Zha F-D, et al. Relationship between body mass index and low skeletal muscle mass in adults based on NHANES 2011?2018. Scientific Reports. 2025;15(1):2596. [ Özet ]
35) Kiss N, Prado CM, Daly RM, et al. Low muscle mass, malnutrition, sarcopenia, and associations with survival in adults with cancer in the UK Biobank cohort. Journal of Cachexia, Sarcopenia and Muscle. 2023;14(4):1775-1788. [ Özet ]
36) Suthahar N, Zwartkruis V, Geelhoed B, et al. Associations of relative fat mass and BMI with all?cause mortality: Confounding effect of muscle mass. Obesity. 2024;32(3):603-611. [ Özet ]